Does a social media post showing a group of maps with overlapping hotspots prove a connection between 5G coverage and the spread of COVID-19? No, that's not true: A similar data distribution of 5G coverage and high numbers of COVID-19 cases on maps does not prove a connection between 5G signals and the viral pandemic. There is no peer-reviewed scientific evidence that 5G causes people to catch COVID. It has been established that the disease develops from a novel coronavirus.
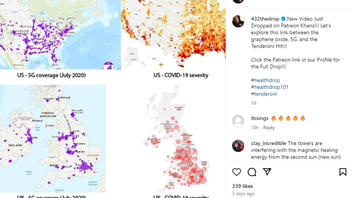
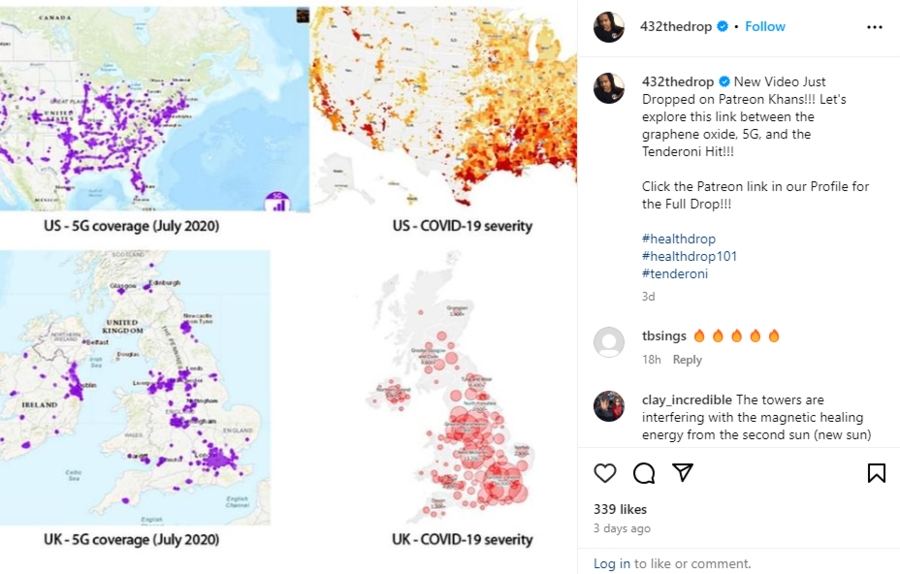
The claim appeared in a post (archived here) on Instagram on February 2, 2024, that included images of four maps. Two of the maps showed the concentration of 5G coverage in the U.S. and the U.K., while the other two maps showed the severity of COVID in those countries. The caption of the post read:
New Video Just Dropped on Patreon Khans!!! Let's explore this link between the graphene oxide, 5G, and the Tenderoni Hit!!!
Click the Patreon link in our Profile for the Full Drop!!!
#healthdrop
#healthdrop101
#tenderoni
This is what the post looked like on Instagram at the time of writing:

(Source: Instagram screenshot taken on Mon Feb 5 17:06:03 2024 UTC)
Lead Stories performed image searches of the maps used in the post made on Instagram. Although the search for the U.K. 5G coverage map did not generate any useful results (archived here), the search for the U.S. 5G coverage map (archived here) led us to an article (archived here) that included a graphic of a 5G coverage map that was similar to the one in the post on Instagram. We went to the website where the article claimed that the image originated and found the 5G coverage for both the U.S. and the U.K. on the website's worldwide 5G coverage map (archived here). We could not verify what the maps looked like in July 2020, as the 5G coverage maps included in the post on Instagram claim to show, but we did locate an archived version of the map taken at the end of June 2020, which looked similar to the images used in the post. The map shows where 5G has been detected, although the website notes that "... certain areas where 5G has been detected are not necessarily commercially open. Indeed, beforehand, technical tests can be carried out by operators and their subcontractors."
Lead Stories also performed image searches of the COVID severity maps for the U.S. (archived here) and the U.K. (archived here). The search for the U.S. COVID severity map led to an article from The New York Times in July 2020, with the graph showing the average daily COVID cases per 100,000 people over the week during which the article was published (archived here). The search for the U.K. COVID severity map led to a webpage published in Korean (archived here) that cited The New York Times as the source of the image, although Lead Stories could only find a similar, not an exact, map on the Times' website (archived here).
While both the 5G coverage maps and the COVID severity cases maps show a similar distribution of data, correlation does not equal causation (archived here). In this case, just because more 5G coverage in the U.S. and U.K. was detected in areas that also had a high number of COVID-19 cases, it doesn't mean that 5G coverage was the factor that caused more COVID cases in those areas. For example, it's possible that both expansive 5G coverage and higher COVID cases in particular areas are due to a greater population density in those areas, although Lead Stories could not confirm this based on the maps alone.
Lead Stories has already debunked the claim that 5G causes COVID. COVID is a disease that can develop after an individual is exposed to the SARS-CoV-2 coronavirus (archived here). We have published several other fact checks related to 5G and COVID-19.


