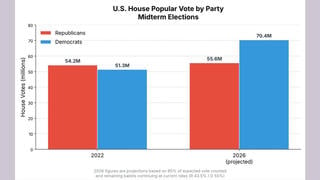
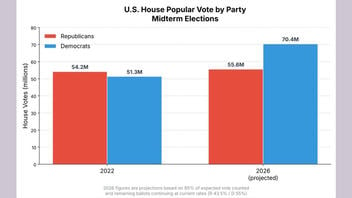
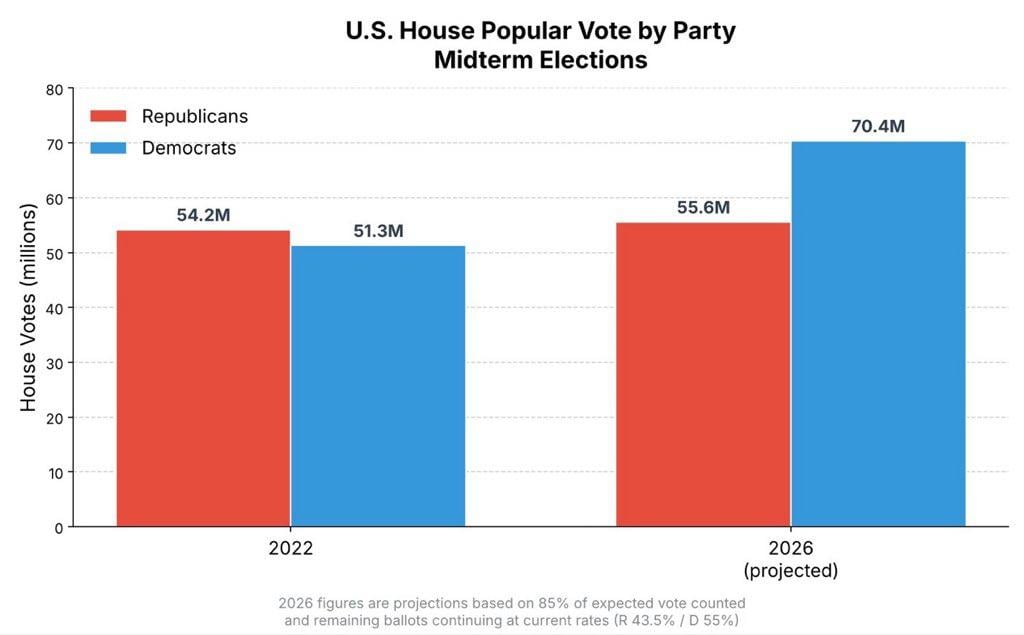
Does a bar chart showing differences between midterm U.S. House results in 2022, and projected counts for 2026, prove that Democrats got 20 million new votes out of nowhere? No, that's not true: The unattributed chart marked "2026 (projected)" shows a reasonable prediction, but the suggestion that 20 million votes or voters just appeared is not justified. Turnout data and exit polls show several variables contributing to the differences, including Trump's approval rating, the economy, and demographic groups who voted differently than they had in the past.
The claim appeared in a post (archived here) by the @kylenabecker account on X on Nov. 5, 2026. It read:
The Democrats got 20 milliom new votes.
That's a 40% increase from out of nowbere.
This is 10 million more than in 2018. When Trump was also on the ballot.
Republicans actually marginally increased turnout from 2022 and 2018.
Republican voters rarely flipped this election, according to NBC News exit polls (~1%).
So these are just new Dem voters "mad about Trump" that are 20% more than his last midterm.
And some Dem candidates apparently outperformed Kamala Harris, including Texas governor-elect Gina Hinojosa.
Hinojosa was actually trailing Abbott in the aggregate polling before the election.
How very odd.
This is what the post looked like on X at the time of writing:
(Image source: post by @kylenabecker on X.)
This chart, in a different Nov. 5, 2025 post on X (archived here), was reposted on Truth Social by Donald Trump on Nov. 7, 2026 (archived here).
The source of the data and chart are unattributed. This fact check does not evaluate the specific projected numbers, as the final vote count is not yet complete. At the time of writing, Nov. 9, 2026, there are still mail-in votes being counted and ballots being cured. Ballotpedia has an article explaining ballot curing (archived here).
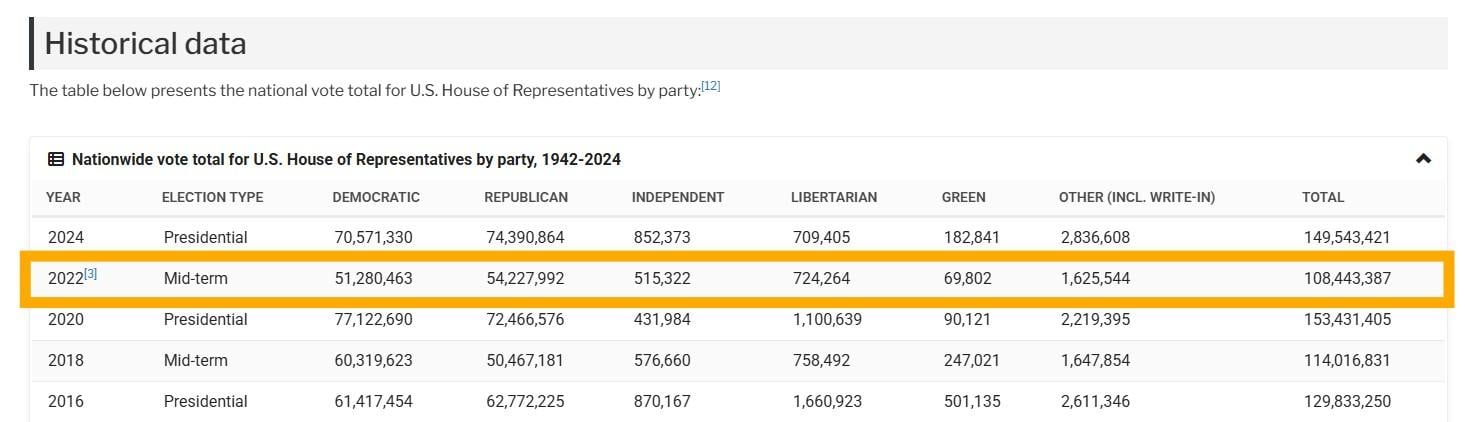
The numbers shown on the chart for 2022 do reflect, with rounding, the data in a table on Ballotpedia (archived here). The table shows the national vote total for U.S. House of Representatives by party from 1942 to 2024. A portion of the table, the data from the last five elections, is pictured below with 2022 highlighted. The data in the table is from the Office of the Historian of the United States House of Representatives (archived here). The Ballotpedia chart shows 54.2M Republican and 51.3M Democrat votes, while the Ballotpedia table records 54,227,992 Republican and 51,280,462 Democratic votes.
(Image source: table from Ballotpedia.)
The Center for Election Innovation and Research
Lead Stories reached out to the nonprofit Center for Election Innovation and Research (CEIR) (archived here), and spoke with the research director, Christopher Mann, by telephone on Nov. 9, 2026. Mann said that this type of claim has surfaced in past elections but there is no evidence of widespread voter fraud then or now. He emphasized that voter fraud is extremely rare. He recommended that people look at the exit poll information published by any of the big networks such as Fox News or CNN. All of them consistently found the same patterns: high turnout and some voters shifting their preferences.
He said that the final count of the mail-in ballots could be finished as soon as Nov. 13, 2026 and certainly by Thanksgiving, and explained that in Alaska the ballots may have to travel quite a distance before they can be counted. We asked about the University of Florida's Election Lab for the numbers on the national turnout with a state-by-state breakdown and Mann said it is an authoritative source.
2022 vs 2026 General Election Turnout
At the time of writing, the UF Election Lab last updated the 2026 General Election Turnout table on Nov. 6, 2026. The projected count total shown in the chart from @kylenabecker is 126 million, while currently the 2026 General Election Turnout table is several million lower.
The total ballots counted in the 2026 General Election Turnout table (archived here) is 123,540,000 with a 49.10% turnout of eligible voters.
The total ballots counted in the 2022 General Election Turnout table (archived here) was 112,030,874 with a 46.12% turnout of eligible voters.
Exit Polls
A Nov. 4, 2026, article (archived here) on Fox News summarizes the situation in the headline:
Fox News Voter Poll: 2026 midterm elections usher in a blue wave as Democrats win control of Congress
Economy, tariffs, government corruption and the Iran war drove voters away from Republicans in key Senate races
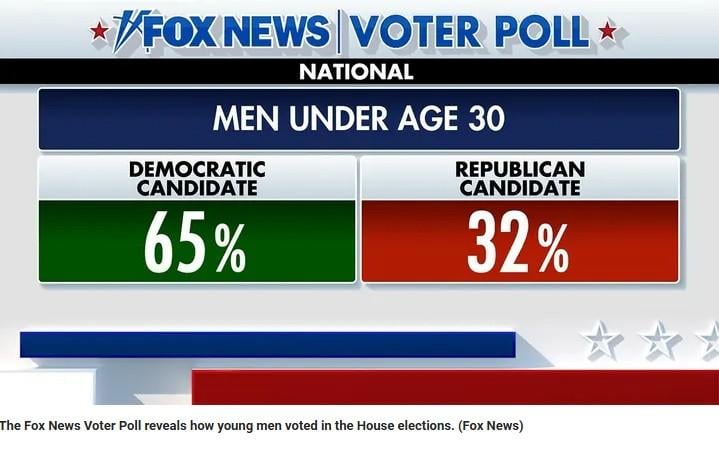
The article includes over fifty graphics from their survey of over 100,000 registered voters between Oct. 19 to Nov. 3, 2026, showing how different demographic groups were voting and what issues were important to them. Male voters under thirty (graphic pictured below) were described by Fox:
Young men made a complete reversal in their party preference, going from a 15-point margin for Trump to a 33-point margin for the Democratic House candidates, a 48-point swing.
(Image source: Fox News.)
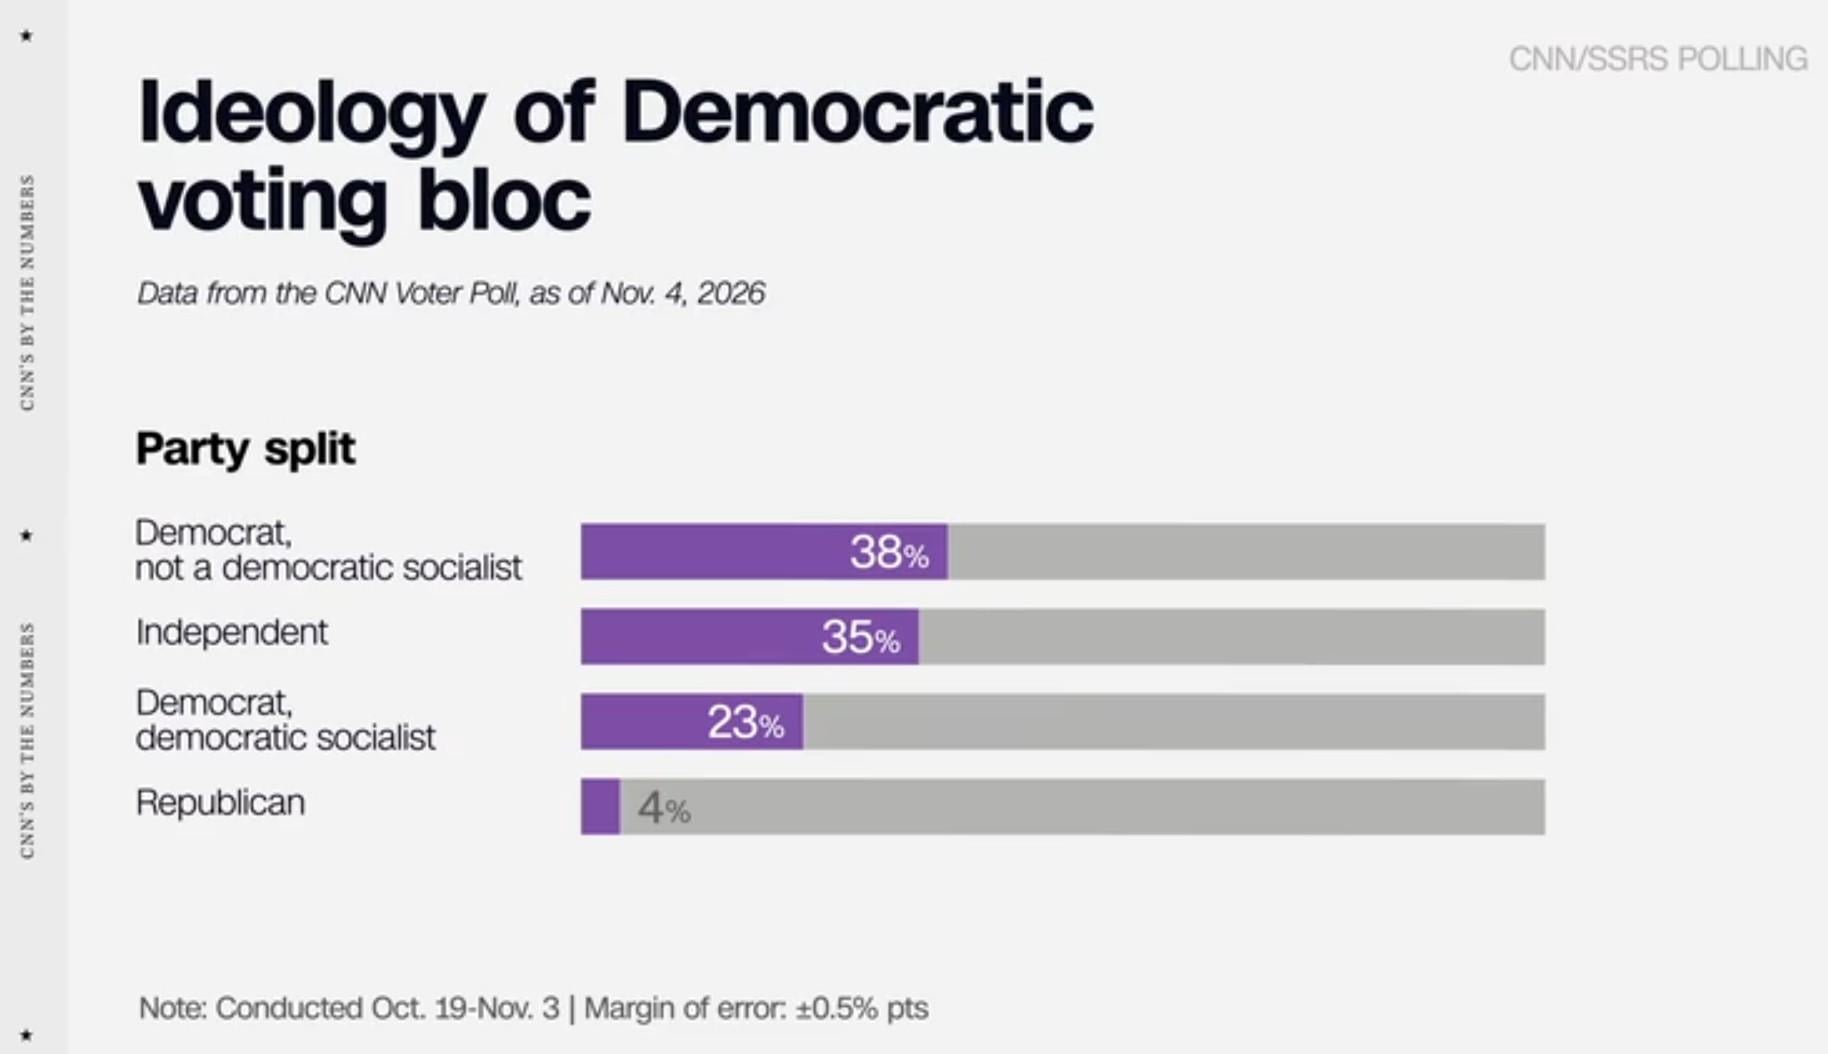
A Nov. 6, 2026, video (archived here) from CNN's polling team titled, "New polls reveal how Democrats rode a blue wave to victory" features a discussion with some of their observations. At one minute in, Ariel Edwards-Levy, the CNN Polling and Analytics Editor, responded to a question about the composition of the voters who chose to vote for Democrats in the House Election. The bar graph (pictured below) was displayed as Edwards-Levy explained:
The first thing that I think is notable is that they picked up people who either voted for Trump or didn't vote in 2024. It's a small share of that electorate but their coalition now does include those people who were formerly in Trump's coalition. You can see they're picking up a significant number of people who don't view either party favorably. We talk about this a lot in politics and polling -- it's the double haters. The other two things I'm looking at here: one is the sort of ideological composition, it's a combination of the sort of Democratic Socialists -- the progressive wing of the party, people who are Independents who say they don't belong to either party, and a small number of Republicans.
(Image source: CNN.)