
Does this colorful graphic chart, with a footnote that the data was sourced from the Centers for Disease Control and Prevention, fairly represent the impact of vaccines on vaccine-preventable diseases? No, that's not true: By carving off the prevaccine years, the chart de-emphasizes the sharp reduction in death by infectious diseases. And by calculating the mortality as a portion of the entire population rather than as a portion of those infected, it also de-emphasizes what vaccination accomplished.
The chart does not fulfill its promise to communicate "just how many people died or suffered permanent harm." CDC-published materials on vaccine-preventable diseases are not dismissive of the harm caused in the past; and this data is not presented as CDC epidemiologists have presented it.
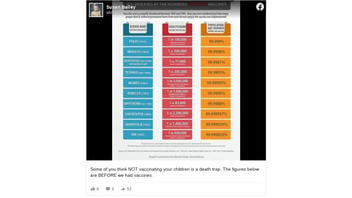
The chart, from a nonprofit called Immunity Education Group, has circulated on social media since at least 2016. One example is a Facebook post (archived here) from August 14, 2020, with the caption, "Some of you think NOT vaccinating your children is a death trap. The figures below are BEFORE we had vaccines." The heading on the chart reads:
U.S. DISEASES BY THE NUMBERS: BEFORE VACCINES
Vaccines were gradually introduced between 1945 and 1995. Have you ever wondered just how many people died or suffered permanent harm from each disease before the vaccine was implemented?
This is what the post looked like on Facebook at the time of writing:

(Source: Facebook screenshot taken on Thu Jun 17 13:13:31 2021 UTC)
The fine print at the bottom of the chart says:
The date the vaccine was introduced refers to the first widespread use in the United States for each vaccine.
The fatality/harm rate reflects the number of people who died or suffered permanent harm from each disease out of the total population at that time.Source: CDC-Reported Cases and Deaths from Vaccine Preventable Diseases, U.S., 1950-2011; Vital Statistics Rates in the U.S. 1940-1960 - Online database
Brought to you by Immunity Education Group : ImmunityEd.org
The source material cited is: "CDC-Reported Cases and Deaths from Vaccine Preventable Diseases, U.S., 1950-2011." Lead Stories was unable to locate that original document on the CDC website, but an updated edition from 1950-2017 is archived here. The second source is an 887-page book produced for the Department of Health, Education and Welfare (available as a pdf) titled, "Vital Statistics Rates In The United States 1940-1960."
In the first source, the numbers of people who became sick or died (cases and deaths) are recorded as an actual number. In the second, they are reported as a rate of deaths per 100,000 population. The notations in the Immunity Education Group chart suggest that long-term harm is included with deaths, but the cited sources do not contain detailed information about short- or long-term harm experienced by the people who did not die. It is not clear if these numbers are included in the statistics and, if so, where they were drawn from.
Missing from the Immunity Education Group's chart is the longer history of the U.S. battle against these diseases. We will look at polio as an example.
This graph below shows how the incidence of polio spiked several times in the first half of the 20th century. Charting methods can communicate the same information differently, but in the case of the Immunity Education Group chart the picture has been limited to only the year that a vaccine was introduced. For polio, that was 1955. This infographic does not give its audience a clear picture of what came before the vaccine, only the mortality rates in a specific year.
In 1916, for instance, there was a terrible polio outbreak; over 27,000 people were sickened and more than 6,000 died. Two out of nine people who were sick, died. Across the whole population, 26.73 people in 100,000 were sickened and 6.97 in 100,000 died.
1952 was the worst year for polio in the U.S. and that year also was not typical in that there were many more cases of paralysis than years past. 57,628 Americans were sickened, 3,145 died, and 21,269 people were paralyzed. In 1952 the fatalities/paralysis rate for polio in the U.S. was 1 in 6,453.
This measure of harm does not factor in the cases of Post-Polio Syndrome, a condition that does not usually appear until 30 or 40 years after a person has recovered from polio.
(Source: Our World In Data: Polio embedded Fri Jun 18 21:55:05 2021 UTC)
The Immunity Education Group graph highlights 1955, the year that the first polio vaccine was introduced. Their chart says, "1 in 100,000 (fatalities/paralysis)."
That year the raw numbers were 28,985 people sickened with polio, 13,850 struck by the paralytic form and 1,043 people killed by the disease. In 1955, 1 in every 159,090 Americans died of polio. Some figures for paralysis that year must be included as the rate in the chart is recorded as 1 in 100,000.
There is a dramatic difference between the statistics of 1952 and 1955 but in the Immunity Education Group's chart, 1955 stands in for the history of the disease in the U.S., even though it saw just about half the cases. The third column's number representing "Population not harmed before the vaccine," 99.999%, is there to give the impression that virtually all the U.S. population was unharmed by polio before the vaccine was introduced. Again, though a rate or percent may appear small, the source material shows that the number of people who fell ill and died before vaccines were introduced is significant.
Other charts are available that compare the prevaccine era morbidity and mortality from vaccine-preventable diseases to the numbers for those diseases now that there are vaccines: here, table 1 here (this is easier to read) and table 2 here. A November 14, 2007, report (downloadable as a PDF file) from the Vaccine-Preventable Disease Table Working Group published by JAMAnetwork.com titled, "Historical Comparisons of Morbidity and Mortality for Vaccine-Preventable Diseases in the United States" notes in the summary comment:
The number of cases of most vaccine-preventable diseases is at an all-time low; hospitalizations and deaths from vaccine-preventable diseases have also shown striking decreases. These achievements are largely due to reaching and maintaining high vaccine coverage levels from infancy throughout childhood by successful implementation of the infant and childhood immunization program. It has been estimated that vaccination with 7 of the 12 routinely recommended childhood vaccines prevents an estimated 33,000 deaths and 14 million cases of disease in every birth cohort, saves $10 billion in direct costs in each birth cohort, and saves society an additional $33 billion in costs that include disability and lost productivity.