Does a viral graph mapping President Trump's result in the 2024 election onto the results of the 2026 Senate election show a uniform, 15% decrease for all states that had a Senate election? No, that's not true: A clearer version of the graph produced by Lead Stories shows only a few states where the number from that calculation matches the actual result within one or two percent, all won by Trump in 2024 and by the Republican candidate in 2026. All the actual results in the other states show variation in both directions, showing much higher or lower numbers than the ones the formula returns.
The graph appeared in a post on X (archived here) published by "Truth is Freedom" on November 6, 2026 which read:
THE 15% BAND
Look at this chart.
59 races. Senate and governor.
States ordered from reddest to bluest in 2024.The solid lines are 2024.
The dashed lines are 2026.
The shaded bands are what moved.One formula fits all of it:
Republican 2026 = 0.85 × Trump 2024
Democrat 2026 = Harris 2024 + 0.15 × Trump 2024For every 1,000 Trump points, 850 stayed Republican. 150 landed on the Democratic side.
The numbers:
Senate: Republicans kept ~85% of Trump's share
Governor: ~86%Variation explained: 88%
What makes it strange:
It didn't matter how red the state was. Wyoming, Ohio, Illinois, Massachusetts: same 15% (p = 0.69). The Democratic gain was sized by Trump's vote, not Harris's. The Harris part is zero.The 0.85 beat both standard election-swing models in every set of races.
Drop any single state and the multiplier stays between 0.846 and 0.853.Why seats flipped:
At 0.85, any state where Trump got under about 58.5% falls below 50%. Texas, Kansas, Iowa, Ohio, South Carolina, North Carolina: all under that line. All flipped.What this means:
Midterms are messy. This one isn't. Two sets of races, different candidates, different campaigns, and the same 15% decrease almost everywhere.A pattern this even demands answers at the ballot level: paper ballot hand counts, poll-book check-ins against votes counted, and voter files showing who actually turned out.
The numbers raise the question.
The ballots can answer it.
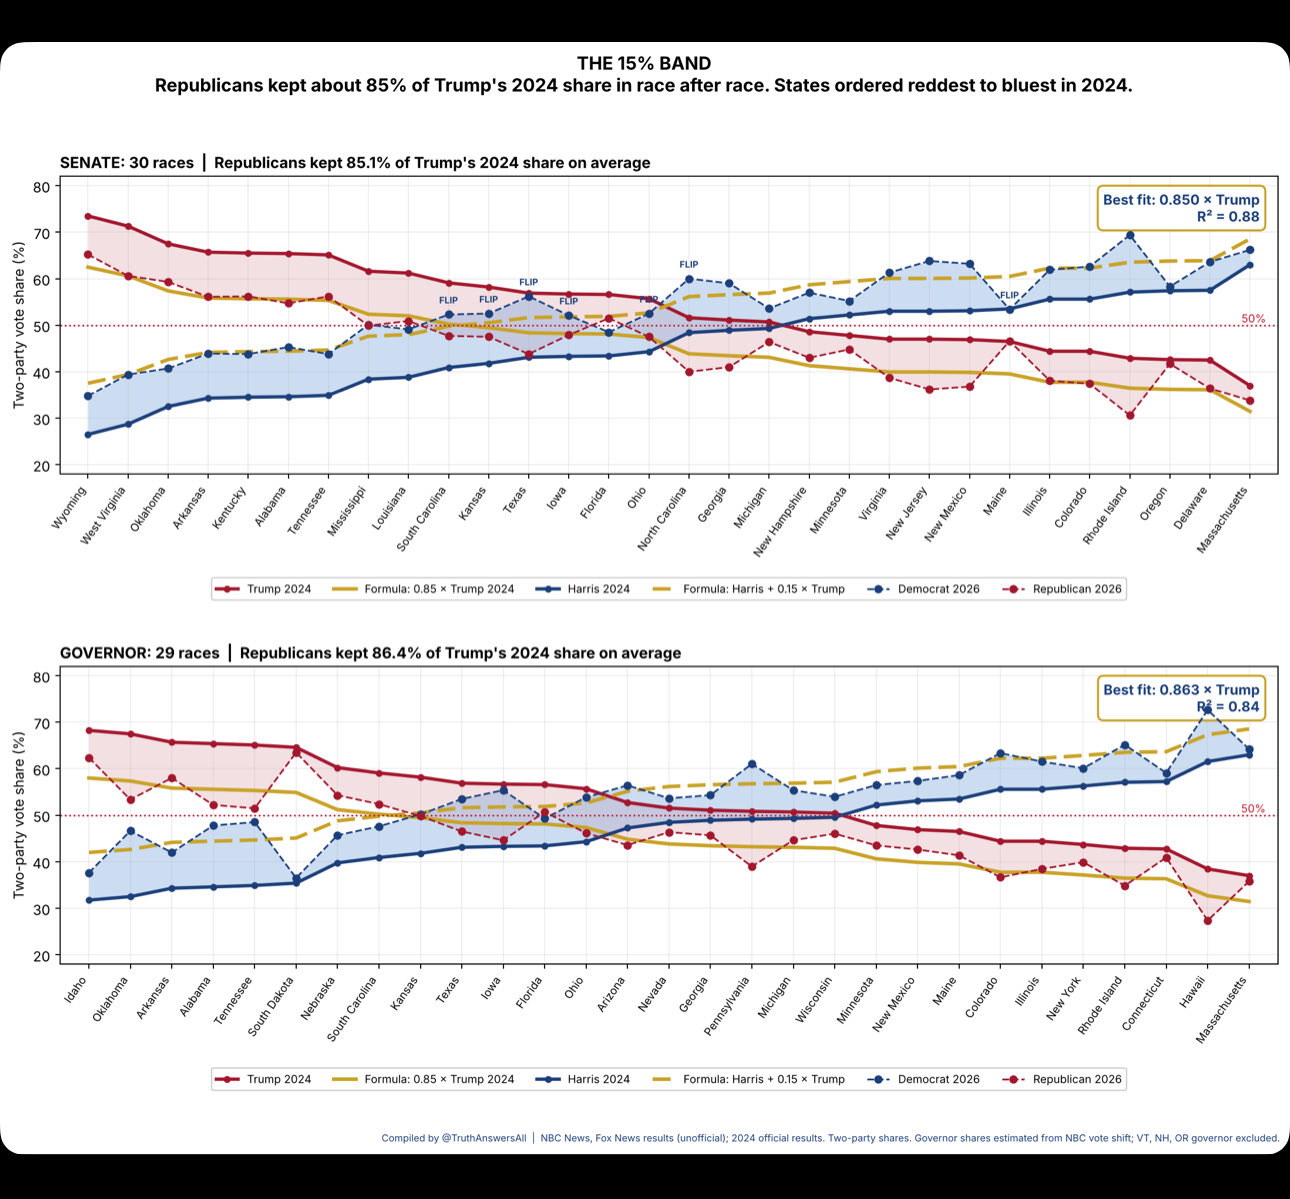
This is what the image in the post looked like:
(Image source: @TruthAnswersAll post on X.)
The graphic was labeled:
THE 15% BAND
Republicans kept about 85% of Trump's 2024 share in race after race. States ordered reddest to bluest in 2024.
It included both the Senate and the Governors' races for 2026 and drew lines claiming to show comparisons between Trump's 2024 result and the 2026 results, with additional lines drawn in showing the results of a formula that calculated a 15% decrease or increase from Donald Trump's or Kamala Harris' result in each state in 2024.
The y-axis of the graph went from 20% to 80% and the graph was very elongated along the x-axis, making all lines appear relatively close together.
Some people interpreted this graph and the post to mean there was a clean, uniform 85% percent ratio between Trump's 2024 result and the various Republican Senate candidates in 2026, for example here at The Gateway Pundit (archived here):
The theory, dubbed the "85/15 Algorithm" that was originally posted by Truth Is Freedom X account, suggests that Republican candidates received approximately 85% of President Trump's 2024 vote share.
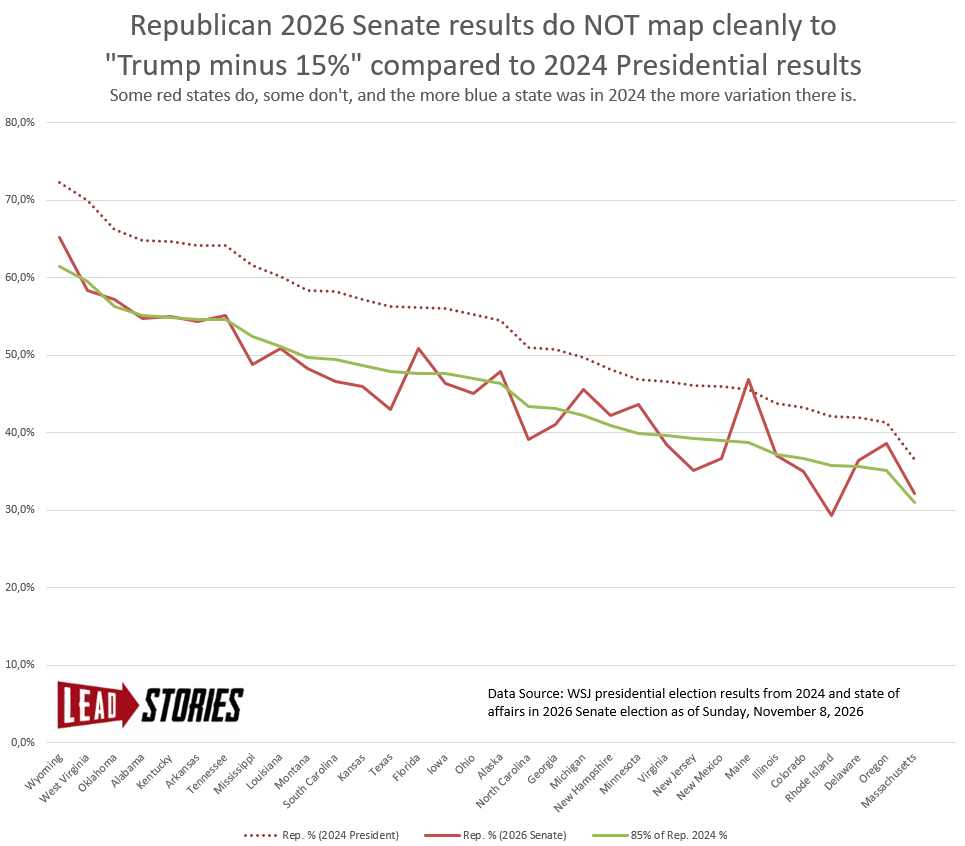
Lead Stories used 2024 Presidential Election data from the WSJ (archived here) and the latest reported 2026 Senate data from the WSJ (archived here) at the time of writing to attempt to recreate the graph. We also added three states that were missing from the original graph (Alaska, Arkansas and Montana). Note that in some states the counts are still ongoing and that our snapshot is from a different moment in time compared to the one in the X post, but the overall shape of the 2024 and 2026 lines is quite consistent between our graph and the one from "Truth Is Freedom".
Omitting the data about the results for the Democrats and plotting the lines on a somewhat narrower, 0% to 80% graph, the actual variation in the 2026 results for the Republican senate candidates compared to the number from the formula based on 85% of Trump's 2024 result becomes much clearer:
(Image Source: Lead Stories)
There is a stretch of red states on the left of the graph (West Virginia, Oklahoma, Alabama, Kentucky, Arkansas, Tennessee, Mississippi) where the 2026 result lines up to within a percent of the formula. But on either end of that stretch there are already differences: in Wyoming the Republican candidate did better and in Mississippi worse than what the formula said. The further to the right of the graph, the more variation there is and the bigger it becomes. In Maine the result for the 2026 Republican candidate was actually better than Trump's 2024 result.
You can download our data here: Trump24-Senate2026-comparison.xlsx