
Is this an accurate list of deadliest days in American history? No, that's not true: While the design of the infographic is clearly well-intentioned, this chart lacks some critical parameters for comparisons. This chart of lethal events separate from each day's unrelated mortality includes natural disasters, acts of war and terrorism, and the coronavirus pandemic, but neglects to include the tremendous loss of life suffered during the Spanish flu pandemic of 1918.
The infographic appeared in a post (archived here) where it was published on December 8, 2020, under the title "Deadliest Days In American History." The text of the graphic reads:
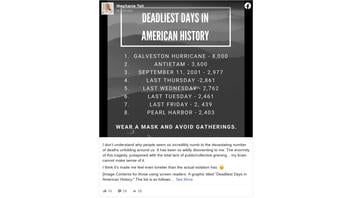
"Deadliest Days in American History."1. Galveston Hurricane - 8,0002. Antietam - 3,6003. September 11, 2001 - 2,9774. Last Thursday - 2,8615. Last Wednesday - 2,7616. Last Tuesday - 2,4617. Last Friday - 2,4398. Pearl Harbor - 2,403
This is what the post looked like on Facebook at the time of writing:

(Source: Facebook screenshot taken on Wed Dec 9 20:05:11 2020 UTC)
The exact death toll from the Galveston hurricane in 1900 is unknown. Counting the deaths that resulted from the storm, rather than deaths in the city limits of Galveston, many more than 8,000 lives were lost. The National Park Service article on the Galveston Hurricane of 1900 reports:
Between 6,000 and 8,000 people in the city died as a result of the storm. Estimated casualties for the entire island range from 10,000 to 12,000. For comparison, Hurricane Katrina (2005), the deadliest storm of recent times, claimed the lives of approximately 1,500 people.
Other than the Galveston hurricane, which occurred before hurricanes were given names, none of the events listed on this graphic have a death toll larger than an average day in the United States in October of 1918. That month, 195,000 Americans died from the Spanish flu -- that would average to 6,290 deaths per day. Surely some days had fewer and some had more deaths. It's possible some days could even have surpassed the Galveston Hurricane record, but Lead Stories was unable to locate by-day death data.
On Thursday December 3, 2020, Worldometer reported 2,926 new deaths and covidtracking.com reported 2,706 new deaths. If it is difficult to find exact agreement in the data from 2020, the challenge of discovering the data from the Spanish flu pandemic of 100 years earlier is understandable, which may be why the 1918 pandemic isn't in the graphic.
The use of the weekdays, "Last Thursday", etc, rather than dates in this "deadliest days" as well as the lack of source references, makes cross-checking difficult. Not all databases present identical numbers. The number 2,861 from "last Thursday" appears to have come from Thursday, December 3, 2020, on the Reuters Coronavirus Tracker. The other days' numbers included in the graphic do not line up identically with the Reuters data from that week. Reuters reported on December 4:
More than 213,830 new cases and 2,861 deaths were reported on Thursday, according to a Reuters tally of official data. With U.S. COVID-19 hospitalizations also at record levels, some experts project the death toll could soon surpass 3,000 per day.
The University of Washington's Institute for Health Metrics and Evaluation now projects nearly 539,000 COVID-19 deaths by April 1, almost double the current death toll, even as vaccines start to become available.
The information about Spanish flu deaths that Lead Stories was able to find required averaging large numbers across a month's worth of days. NorthJersey.com relays the historic monthly record from the state Department of Health; in New Jersey alone the flu death toll jumped from 222 in the month of September to 8,477 deaths for the month of October 1918, for an average of 273 Spanish flu deaths per day. Reported NorthJersey.com:
In a report at a conference of state and local health officials in Trenton in January 1919, Synnott noted the uniqueness of this virus: "The extraordinary toxicity, the marked prostration, the extreme cyanosis, and the rapidity of development stamp this disease a distinct clinical entity heretofore not full described."
A state Department of Health report listed 4,010 deaths in New Jersey in September 1918, with 222 caused by influenza.
By the next month, there were 17,260 deaths in the state, with an astounding 8,477 attributed to the flu pandemic.
Philadelphia was a city very hard hit by the Spanish flu as reported on History.com. The flu epidemic spiked in the days after a parade, filling the hospitals. In October of that year, 11,000 residents died This would average out to 354 deaths a day, but more than twice that many, 759 people, died on the deadliest day in October 1918 in Philadelphia. History.com's article says:
Drivers of open carts kept a near-constant vigil circling streets while hollering, "Bring out your dead!" They then deposited the collected corpses in mass graves excavated by steam shovels.
After taking the lives of 195,000 Americans in October 1918, the Spanish flu dissipated as quickly as it had arrived, although it had a brief resurgence after crowds flooded city streets to celebrate the November 11 announcement of the armistice. Between war and sickness, life expectancy fell from 51 to 39 years of age in 1918, according to Davis.
At 195,000 American deaths in one month from Spanish flu the average would be 6,290 per day. That's more than twice the number (2,861) of people who died 'last Thursday' December 3, 2020. Is it informative to compare these two numbers without taking the population into consideration? The U.S. population in 1918 was 103,208,000 and currently it's 330,690,003. That means that on an average day in October 1918, out of every 100,000 Americans, 6.1 died from Spanish flu, while on December 3, 2020, less than one person in a hundred thousand, (0.8) died of COVID-19.
In October of 1918, an average of 273 people died per day in New Jersey. On December 8, 2020, Worldometer shows California with the highest number of new deaths in the USA, 212. That is still lower than the number from 1918 New Jersey -- but compare the 1918 population of New Jersey (3,043,000) to the 2020 population of California (39,512,223). California currently has about 13 times more people. In the month of October 1918 New Jersey was losing about nine out of every 100,000 people every day while in early December 2020, California lost one of every 200,000 every day.
Only time will tell how the numbers of these two pandemics will compare, but when speaking of individual deadly days, even without having the exact daily data from 1918 to compare, averaging death totals over a number of days gives us a more clear picture of how devastating the Spanish flu was.
The eight-point list of this graphic ends with "Pearl Harbor - 2,403." There are several other disasters not included in this list with a higher death toll than Pearl Harbor, but none of these surpasses the averaged numbers claimed by the Spanish flu on any day in October 1918.