

Did election data scraped from The New York Times website by a user of the messaging board thedonald.win show evidence of massive shifts in votes? No, that's not true: Lead Stories' analysis of the data message reveals that most of the shifts or drops in votes claimed by a user called "PedeInspector" is simply the result of mathematical rounding. Also worth noting: PedeInspector's analysis used data from a private election services company which had been formatted to automatically update Times graphics displays. It did not contain actual vote counts for the candidates. PedeInspector worked backward from the graphics-friendly ratios and multiplied the official counts of total number of votes with the (rounded) ratio of votes for each candidate found in the data created to feed into the graphics. Rounded numbers are by nature not exact, so any analysis relying on them to make statements about exact numbers is virtually guaranteed to be wrong.
The message board's claim about shifts in votes eventually made it to President Trump's twitter feed but it started going viral because of a thread published on thedonald.win on November 11, 2020 titled "HAPPENING!!! CALLING EVERY PEDE TO BUMP THIS NOW. FULL LIST OF VOTES SWITCHED OR ERASED BY DOMINION!!! AND ALL THE EVIDENCE!!! THIS IS A NUKE" (archived here) which opened:
EVERY THING YOU'RE ABOUT TO READ IS VERIFIED AND WAS MADE BY THIS PEDE; HE DID ALL THE HEAVY WORK
That thread referenced an earlier thread (archived here) by a user named "PedeInspector" who claims to have downloaded files from The New York Times website containing data about state election results. Lead Stories independently verified these files were indeed present and publicly available.
The files contain long sections with entries like these:
...
}, {
"vote_shares": {
"trumpd": 0.497,
"bidenj": 0.49
},
"votes": 6579145,
"eevp": 94,
"eevp_source": "edison",
"timestamp": "2020-11-06T01:50:36Z"
}, {
"vote_shares": {
"trumpd": 0.497,
"bidenj": 0.49
},
"votes": 6580387,
"eevp": 94,
"eevp_source": "edison",
"timestamp": "2020-11-06T02:04:35Z"
}, {
"vote_shares": {
"trumpd": 0.497,
"bidenj": 0.49
},
"votes": 6583180,
"eevp": 94,
"eevp_source": "edison",
"timestamp": "2020-11-06T02:06:34Z"
},...
These look like time series of overall total vote counts, percentages possibly indicating how complete the results are plus the ratio of votes for the two main candidates, Trump and Biden, at each point in the series.
Right away it is clear there are no exact vote counts for either candidate in the files and there also appears to be no data for third-party candidates. So, it appears these files are not meant to be complete representations of the election results.
Lead Stories reached out to The New York Times and to Edison Research, which the Times confirmed it hired to supply election data, to inquire about the exact purpose of these numbers. The Times spokesperson was sent the November 12 version of Lead Stories' review of the math and has not challenged Lead Stories' educated guess that these time series are meant to create "live" displays or graphs of total votes counted, plus the percentage for each candidate in a given state over time, based on the unofficial results being transmitted by Edison Research in real time, ahead of the official certification of all the results by the Secretaries of State of every state.
What "PedeInspector" appears to have done is to take the total vote count at each moment in time and multiply it by Edison's ratio of each candidate to get their number of votes. Subsequently he looked at how those numbers evolved over time and called foul if the number for a given candidate appeared to go down, declaring that proof of fraud. Lead Stories scraped the same data from the New York Times' website and applied the method PedeInspector describes in multiple posts on thedonald.win.
The important factor Lead Stories found is that the graphics-friendly ratios in the scraped data only appear to have at most three decimals so the biggest change they can register is 0.001 (or 0.1%). If standard rounding is applied, this means the real ratio could be anything between 0.0005 higher or lower (or 0.05%). That may not seem like much but when you are dealing with hundreds of thousands (or even millions) of votes, it adds up. Here's an example we created in Excel for a hypothetical election with candidates A and B:
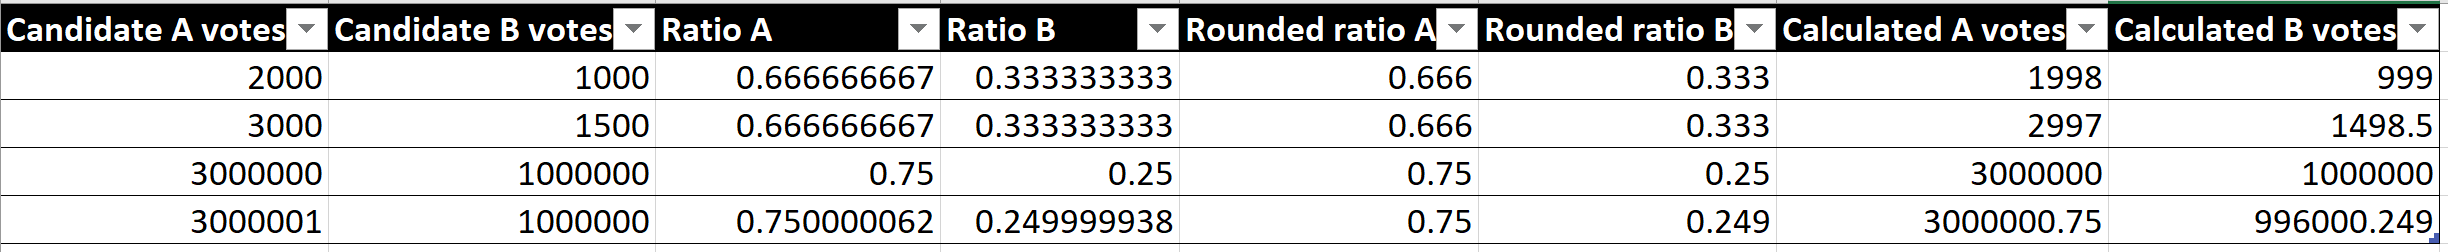
The first two columns show the actual vote counts, the next two show the ratio with the default nine-digit precision in Excel. The next two columns show the ratios rounded to the third decimal like in the Edison files PedeInspector used. The final two columns show what the vote count would be if the total vote count was multiplied by the rounded ratio for each candidate.
As you can see right away, even with relatively small numbers of votes, the calculated numbers of votes are immediately off by a few compared to the real numbers. Only if the ratio by chance happens not to need rounding does the calculated number of votes line up with reality, like it does in the third row.
But add one vote, as you can see in the last row, and the rounded numbers shift. In this case, one extra vote for A in the real vote count makes it appear B lost around 4000 votes in the calculated number (while A only gains a fraction of a vote).
Obviously, this is not evidence someone stole or shifted 4,000 votes, it simply means you can't calculate exact vote counts from rounded data.
To check the PedeInspector data, we downloaded the CSV file offered in the thread on thedonald.win that contained all the data which PedeInspector described as follows:
[pede444wow] I took the json files that are included here, and wrote a python script to convert the critical data to one csv file, so you can analyze it in excel:
python script: https://pastebin.com/Q6nTP04N
result csv file: (download and save to csv file, then open in excel) https://pastebin.com/FQuxxTvK
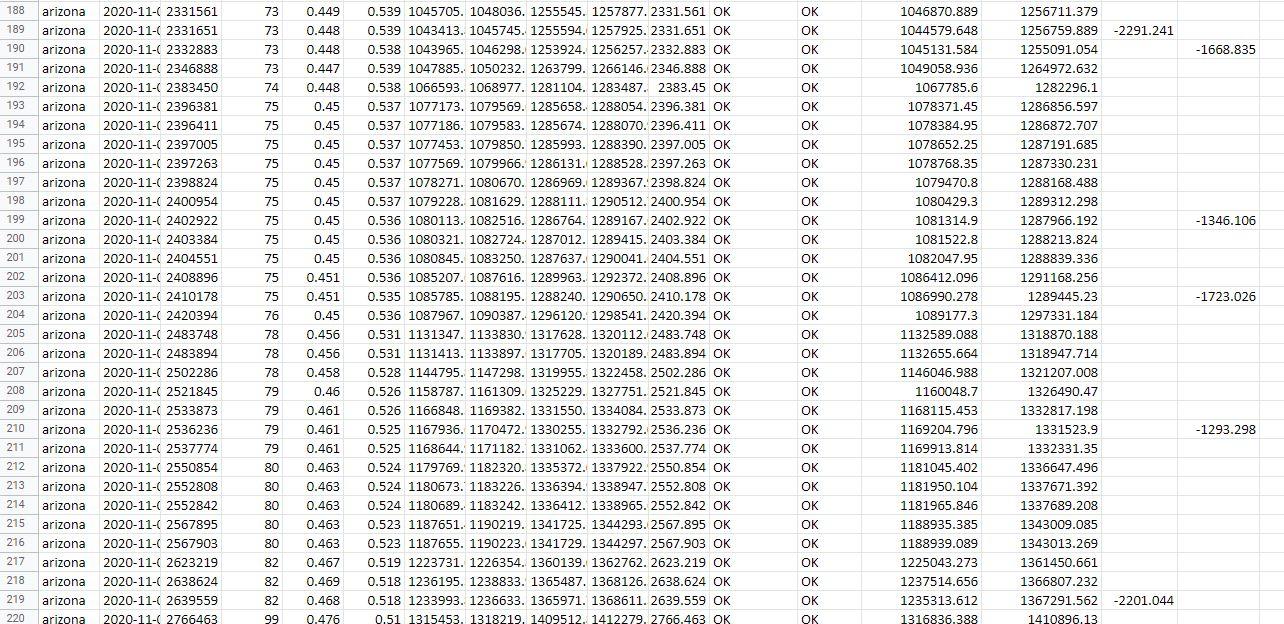
We imported the numbers in Excel and then went to work adding several extra columns with calculations and conditions:
- Trump Min/Max & Biden Min/Max: minimum and maximum possible number of votes a candidate could have given the ratio and the rounding, calculated by adding or subtracting 0.0005 to the ratio for a candidate and multiplying with the total number of votes We know the actual number of votes for a candidate must be somewhere between these two values.
- 0.1% is...: This column represents what a 0.001 (or 0.1%) shift in the ratio represents in number of votes, for illustrative purposes.
- Max > Last Min?: Column that says "OK" if the maximum possible number of votes for both candidates is higher than minimum possible amount in the previous row, and "NOT OK" otherwise, because that would mean any current possible number of votes for a candidate would be lower than what was previously already calculated to be the minimum possible amount.
- Votes up?: Column that says "OK" if the total number of votes is higher than in the previous row, and "NOT OK" otherwise as this would indicate the number of votes is the same or lower.
- Trump/Biden ratio * votes: PedeInspector's (flawed) calculation to arrive at the number of votes for a candidate.
- Trump/Biden down: If PedeInspector calculated votes go down from one row to the next, this row contains the difference.
This means a row with two "OK" columns is one where the number of votes goes up and the minimum and maximum possible amounts of votes are possible given the values in the previous row.
So, what did we find?
PedeInspector's method finds many, many drops for both candidates that can be perfectly explained as the result of rounding, where our tests indicate a possible valid number of votes exists that would fit within a rising series and would match with the range of possible ratios.
These (miscalculated) drops affect both Biden and Trump, if you add them all together Biden "loses" around 1.2M votes against Trump's 2.5M, for a total of almost 3.7M.

But most of these drops are not real because of the error introduced by rounding. And adding them together would also not be correct as they are mostly balanced out by corresponding rises in the other rows, likewise caused by rounding.
To be fair, there are a number of anomalies and glitches in the data, which is to be expected if you use unofficial results being reported in real time. In one famous case Antrim County made a 6000-vote mistake typing in the unofficial results that was later corrected so it is not unusual to see mistakes, clerical errors and typos in data based on such provisional results on Election Night.
Sometimes, the total number of votes goes down, sometimes quite drastically. Of course, this affects both candidates roughly equally as long as the ratios remain the same.

Sometimes this coincides with an "impossible" drop in the maximum number of votes for a candidate, bringing it below the minimum possible number from the previous row. But if the total number of votes drops by a big enough number that is to be expected.

Many cases are likely simply updates being made to fix data entry mistakes. For example, this drop in Trump votes is caused by a full 1% drop in Trump's ratio but only a 0.5% rise in Biden's ratio. The next update shows a return to a more sane ratio for Trump and a slight drop in Biden's.
![]()
Sometimes the total number of votes also stays identical between two updates and just the ratios change, but often the next update then keeps the new ratios and updates the total vote count, indicating this is likely also clerical error or an incomplete update.
![]()
(Note: red highlights in the file mean the total number of votes went up as expected but the new maximum possible number of votes for one candidate doesn't jive with the minimum possible in the previous row).
Does any of this prove massive fraud or huge shifts in votes? No: Edison's graphics-friendly data are derived from unofficial, real-time tallies and then rounded to create graphics-friendly numbers. Plus, they don't include third-party candidates. There might be some glitches here and there that might warrant a second look to figure out how they happened. But contrary to claims by PedeInspector and the President of the United States, there is no evidence here of massive vote shifts.
For reference, here is the entire sheet with our calculations, you can also see it online here:


