
STORY UPDATED: check for updates below.
Are 97 percent of the guns in the United States located in areas that account for only three percent of gun violence? No, that's not true: Gun violence experts told Lead Stories that different statistics demonstrate a correlation: In regions where gun ownership is more prevalent, there is a corresponding increase in gun-related fatalities. This is supported by data from the Centers for Disease Control and Prevention. Additionally, data at less than the statewide level, as illustrated in the claim, is difficult to come by, one of the experts said.
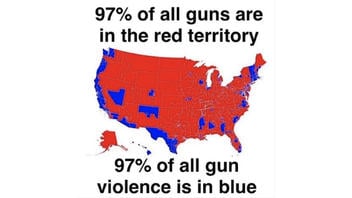
The claim appeared in a post (archived here) on Instagram by deinfringe__ on February 21, 2024, under the on-screen title "97% of all guns are in the red territory. 97% of all gun violence is in blue." The post's caption said:
I bet you could determine more in this map...
This is what the post looked like on Instagram at the time of writing:

(Source: Instagram screenshot taken on Fri Feb 23 17:29:50 2024 UTC)
The map
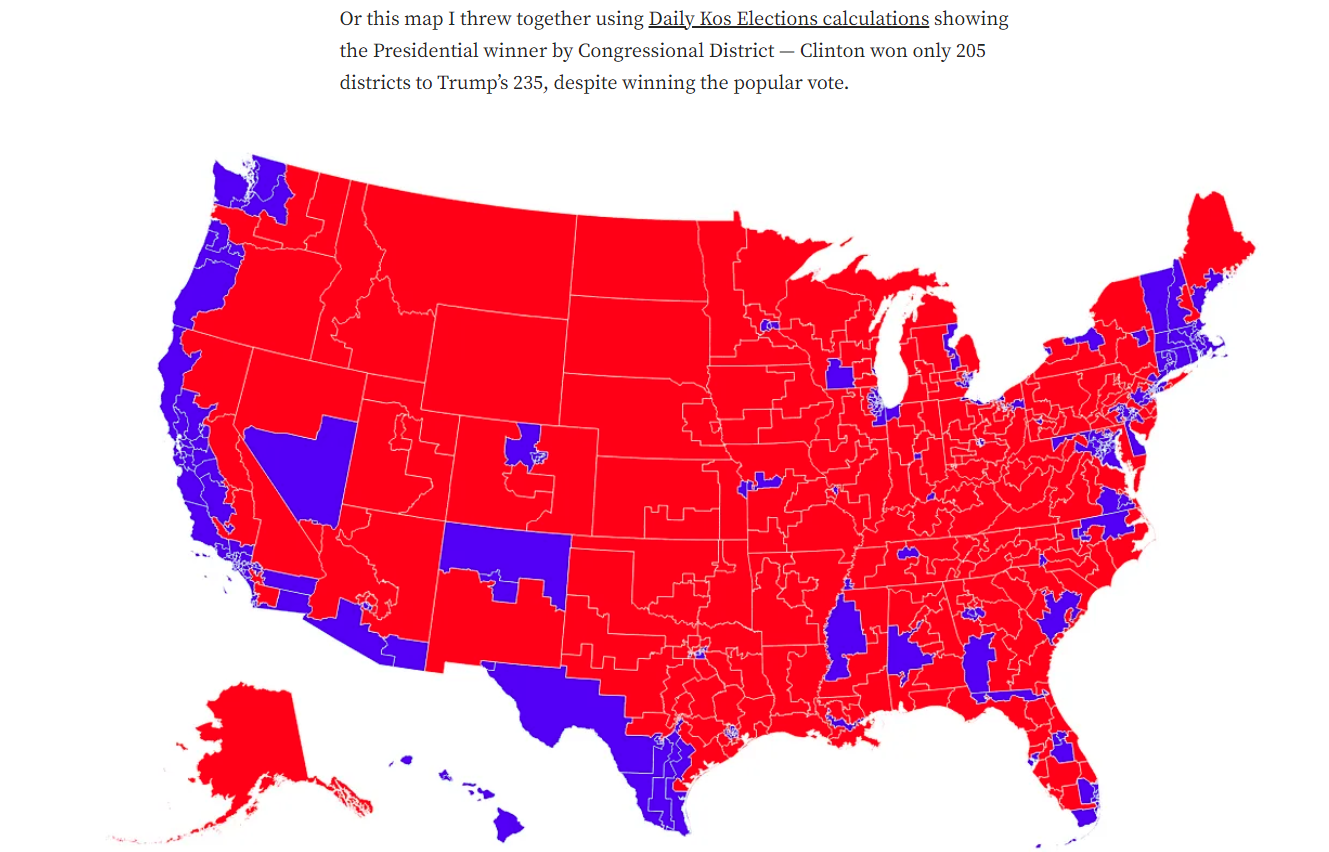
Separate from the gun violence numbers, the map included in the post has nothing to do with those figures. The map is from the 2016 presidential election between Donald Trump and Hillary Rodham Clinton. The image was included in a story on the Medium website (archived here) and was used to illustrate the "Presidential winner by Congressional District." Lead Stories found it by doing a reverse image search on TinEye (archived here), an image search and recognition website.
The congressional districts marked blue voted for Clinton. The red ones voted for Trump. A screenshot of the map on Medium.com appears below:
(Source: Medium screenshot taken on Fri Feb 23 20:47:38 2024 UTC)
Center for American Progress
Independent of our research, Nick Wilson, senior director of gun violence prevention at the Center for American Progress (CAP), a nonprofit think tank in Washington, D.C., came to a similar conclusion about the map purportedly showing gun violence and gun distribution in the United States. In a February 23, 2024, email to Lead Stories, Wilson said:
That's maybe the worst map I've ever seen about gun violence. But that's because it has nothing to do with gun violence - it appears to be a congressional map by party, one that is outdated or inaccurate no less.
Neither the 3% nor the 97% stats seem to have any truth.
Since we do not have universal background checks, licensing requirements, or a federal registry of firearms, we do not know how many guns are in counties or congressional districts. There are surveys estimating gun ownership at the state level, but I'm not familiar with resources to get more granular data.
The suggestion in the social media post is that there is less gun violence in areas with more guns and more gun violence in areas with fewer guns. No source for the claim is listed and no data is provided.
Director of the National Collaborative on Gun Violence Research
Andrew Morral, director of the National Collaborative on Gun Violence Research at the RAND Corporation, told Lead Stories in a February 26, 2024, email that the map in the post raises lots of questions. He said:
I just don't know where he would get the information on where the guns are. I also don't know what he is counting as gun violence. For instance, let's say he doesn't count firearm suicides as firearms violence (and firearm suicides are more common in rural areas than nonrural areas), but he does count firearm homicides as violence. Looking just at the states ... that appear to be all red (AK, AR, ID, IA, MT, NB, ND, OK, SD, UT, WV, WY), they already account for about 5% of total firearm homicides in the most recent four years of CDC data (2018-2021). Adding in the red counties from the remainder of the states would increase that value considerably, as almost all states include some red counties. ...
My bottom line: until he shares his definitions and his data sources, I would assume his claim is incorrect. Moreover, I would be quite surprised if there are any definitions or valid data sources that bear out this claim. In particular, I don't think there are any valid data sources for estimating where in the country guns are located that are precise down to the county level. In particular, the federal government is prohibited by law from keeping track of who owns guns, and only a few states have firearm registration systems that would allow for counts of firearms by county.
Johns Hopkins Center for Gun Violence Solutions
In a February 23, 2024, email to Lead Stories, the Johns Hopkins Center for Gun Violence Solutions disputed the assertion in the Instagram post. The Center issued this statement:
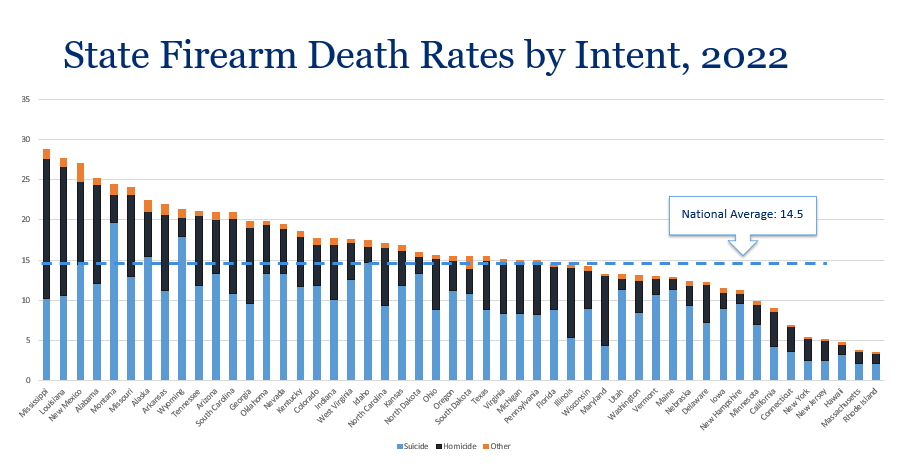
There is no evidence to support the claim that more guns equals less violence. In fact, the opposite is true. In places with higher levels of gun ownership, we see higher rates of gun deaths (see chart below). There are numerous contributors to gun violence - the biggest of which is easy access to guns. We also see gun violence concentrated in areas where we have also concentrated social vulnerability and targeted disinvestment.
The Center provided Lead Stories with the chart, which it said is based on Centers for Disease Control and Prevention (CDC) provisional data:
(Source: Johns Hopkins Center for Gun Violence Solutions on Fri Feb 23 2024 UTC)
CDC firearm mortality map
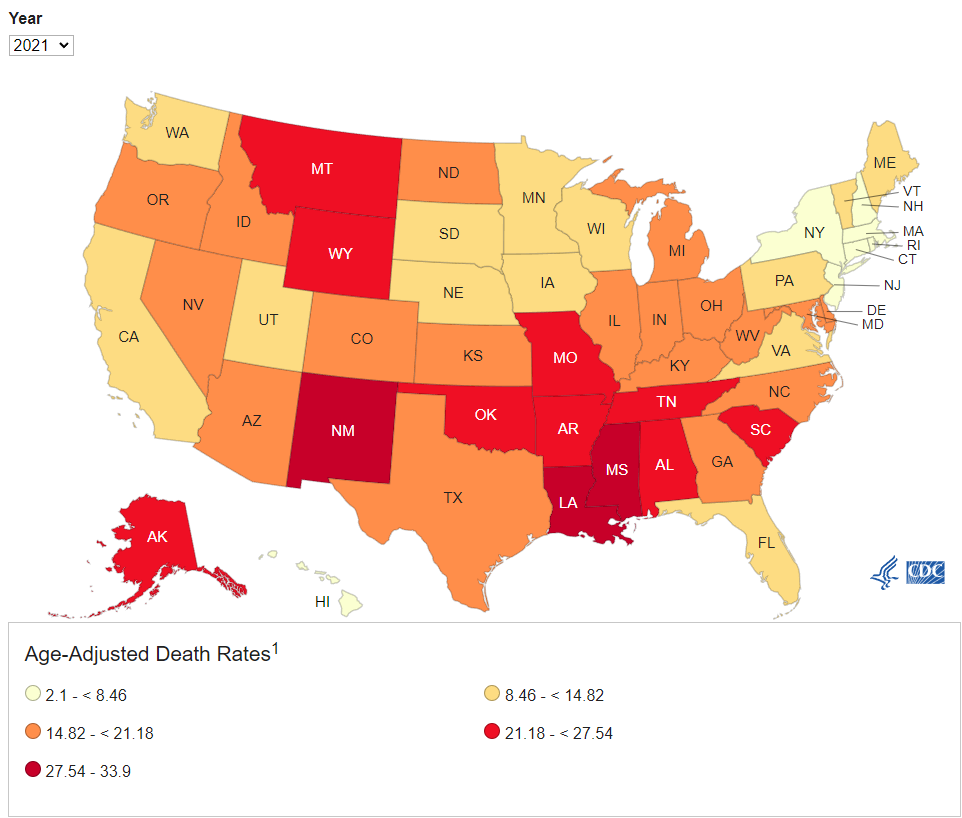
Additional CDC data on "Firearm Mortality by State" is available here (archived here) and is illustrated in the map below. (Red is a higher death rate. Lighter shades are lower rates.)
(Source: CDC screenshot taken on Fri Feb 23 23:09:08 2024 UTC)
The graphics appear to disprove the claim put forward in the post on Instagram. Firearm death rates in the blue sections of the map, which include the population centers in California, Washington, Vermont, New Hampshire, Delaware, New York, New Jersey and Connecticut, all fall below the national average.
Separately, Wilson came to a similar conclusion. He said:
Many of the states highlighted blue have less gun violence than the national average. This includes states with strong gun laws and fewer guns like Hawaii, and states like New Hampshire with weak gun laws and more guns, and Vermont with medium gun laws.
Research consistently shows that more guns is correlated with more gun violence.
Southern and Midwestern states with loose gun laws, high rates of gun ownership, and large rural populations have contributed to a rise in gun homicides. From 2016 to 2020, 13 of the 20 U.S. counties with the most gun homicides per capita were rural.
Wilson said additional details can be found in the Center for American Progress' online fact sheet from September 26, 2022.
Additional Lead Stories fact checks of claims about gun violence can be found here.
Updates:
-
2024-02-26T22:58:33Z 2024-02-26T22:58:33Z Adds context from Andrew Morral at the National Collaborative on Gun Violence Research