Were there 353 counties in 29 states with voter registrations exceeding "100 percent" and is that definitive evidence of something? No, that's not true: the social media account making that claim omits to say the "100 percent" is not referring to eligible voters. The numbers are from a study published by Judicial Watch that compared all voter registrations (including inactive ones) to imprecise census population estimates based on surveys. The inexact nature of the numbers is not mentioned in the social media post.
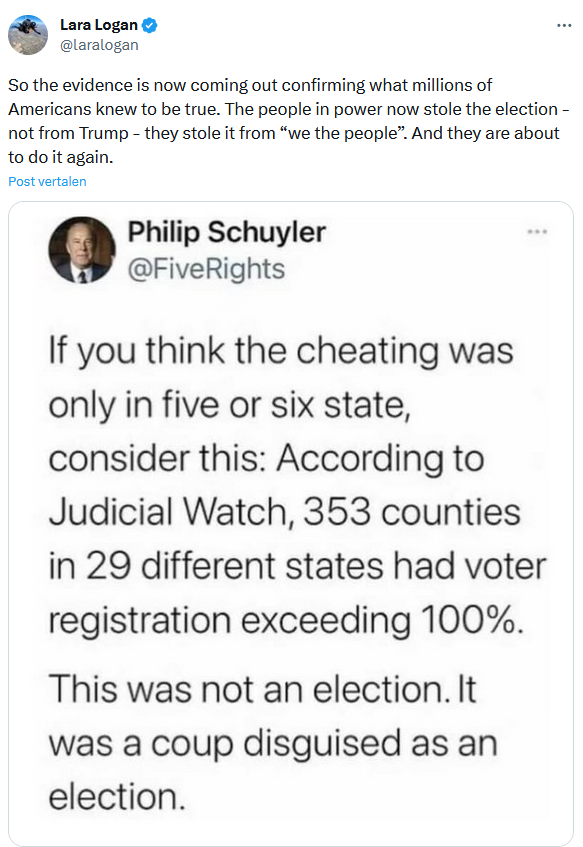
The claim appeared in a post (archived here) by Lara Logan on X, formerly known as Twitter, on September 5,2023. It opened:
So the evidence is now coming out confirming what millions of Americans knew to be true. The people in power now stole the election - not from Trump - they stole it from 'we the people'. And they are about to do it again.
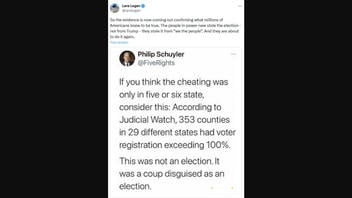
This is what the post looked like on X at the time of writing:
(Source: X screenshot taken on Wed Sep 6 17:50:51 2023 UTC)
The tweet includes a screenshot of a message that says:
If you think the cheating was only in five or six state, consider this: According to Judicial Watch, 353 counties in 29 different states had voter registration exceeding 100%. This was not an election. It was a coup disguised as an election.
These numbers appear on the Judicial Watch website (archived here) in an article titled "New Judicial Watch Study Finds 353 U.S. Counties in 29 States with Voter Registration Rates Exceeding 100%." According to Judicial Watch, these numbers show the ratio between voters on county voter rolls compared to an estimate of the population provided by the American Community Survey (ACS) of the U.S. Census bureau from 2014 through 2018.
This doesn't necessarily prove election fraud as the voter rolls sometimes include old names, people who moved and inactive voters who haven't actually requested a ballot or voted in years. The actual population count is sometimes higher than an estimate based on a survey from several years ago. Lead Stories wrote about a similar Judicial Watch report here and the same report here in the past.
For example, here are some numbers from the Virginia section of the Judicial Watch article:
Virginia: Loudoun County (116%); Falls Church City (114%); Fairfax City (109%); Goochland County (108%); Arlington County (106%); Fairfax County (106%); Prince William County (105%); James City County (105%); Alexandria City (105%); Fauquier County (105%); Isle of Wight County (104%); Chesterfield County (104%); Surry County (103%); Hanover County (103%); New Kent County (103%); Clarke County (103%); King William County (102%); Spotsylvania County (102%); Rappahannock County (102%); Albemarle County (101%); Stafford County (101%); Northampton County (101%); Poquoson City (100%); Frederick County (100%)
What these numbers definitely don't show is the actual turnout. You can find actual Virginia registration and turnout numbers on the website of the Virginia Department of Elections, archived here and here.
Looking at the numbers for the top three in the list it quickly becomes obvious the real turnout rates are much lower. For Loudoun County the data shows 282,263 registrations and a turnout of 225,611 (about 79.9 percent). For Falls Church City there were 11,126 registrations and a turnout of 8,887 (about 79.9 percent). Fairfax City had 17,373 registrations and a turnout of 13,592 (about 78.2 percent).
Other Lead Stories fact checks about election fraud can be found here.


