

Did a "New York Times Election Report" reveal 104,984 Stolen Votes in Georgia and 347,768 in Pennsylvania? And was this report published by a "European paper" because the rest of the world gets different news? No, that's not true: the headline "New York Times Election Report Reveals 104,984 Stolen Votes in Ga, 347,768 in PA" appeared in the Central City News, a small Louisiana newspaper, on November 19, 2020 (archived here) and it was based on faulty analysis of data containing rounded percentages that was used on the website of the New York Times to create graphical representations and which did not contain exact vote counts.
The claim regained prominence in late December 2020 through a meme containing a photo of the newspaper front page (with the title cut off but still showing the headline "How Election Was Stolen") along with the words:
Funny how the rest of the world gets different news than us.
European paper
An example of the meme could be seen in this Facebook post (archived here):

(Source: Facebook screenshot taken on Sun Jan 3 21:26:40 2021 UTC)
Lead Stories was able to locate a screenshot of the full front page:

According to their website, Central City News is a small community newspaper (archived here) with a circulation of about 10,000 in the city of Central, Louisiana (which is definitely not in Europe despite what the meme claims).
The actual newspaper article claimed data found on the website of the New York Times contained timestamps and vote totals for both major candidates of the 2020 U.S. Presidential Election during the vote counting on election night and beyond:
Unraveling this mystery begins with The New York Times. After polls closed on Election Day, The Times begin to report the results hour after hour. The coding for that data is still online, and we have downloaded it in case it is taken down. The data from The Times shows the time, expressed as UTC, or Uni- versal time, which is Greenwich mean time in England. It also shows the totals for Trump and Biden, Trump's lead, and then new votes for Trump and Biden as each change in the results was uploaded.
However, as far as Lead Stories was able to determine this exact data was not present on the website of the New York Times.
How do we know? Because on November 13, 2020, six days before the Central City News article came out, Lead Stories already did an analysis of voter fraud claims being made on the basis of New York Times data by a user named "PedeInspector" on a forum website.
The data we found did not contain "totals for Trump and Biden, Trump's lead, and then new votes for Trump and Biden". It contained rounded percentages for Trump and Biden and the total number of votes cast, and it was likely used to create graphical representations on the NYT website.
Why is that important? Because there is no way to calculate an exact vote count for a candidate based on a rounded percentage and the total vote count. There will always be rounding effects so the best info you can get out of these sorts of numbers is that the number of votes for a candidate is "somewhere between x and y votes".
That means you can't say a candidate gained (or lost) precisely this many votes between updates. As we said in our earlier reporting about the Edison Research data found on the New York Times website:
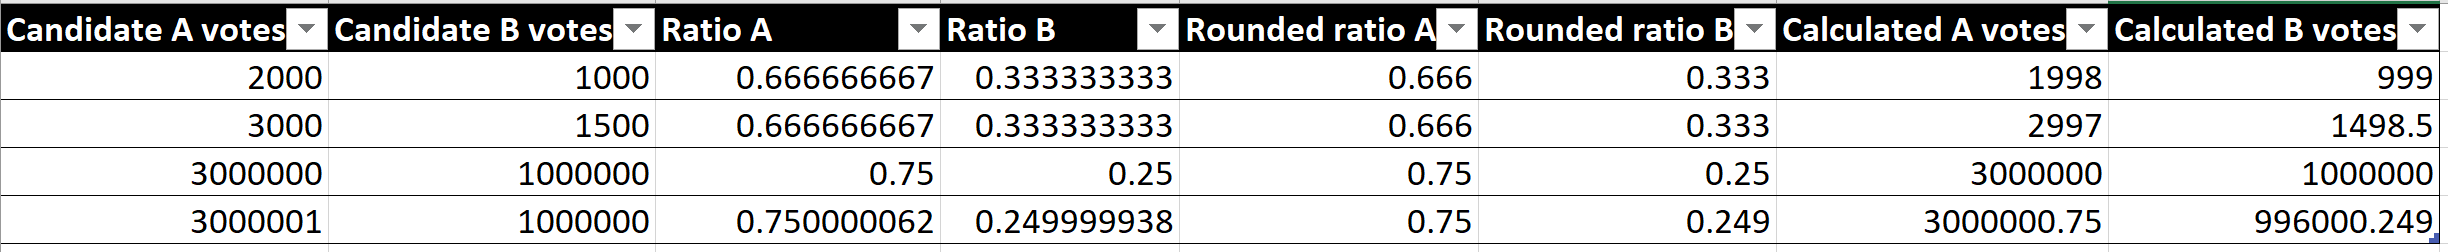
The important factor Lead Stories found is that the graphics-friendly ratios in the scraped data only appear to have at most three decimals so the biggest change they can register is 0.001 (or 0.1%). If standard rounding is applied, this means the real ratio could be anything between 0.0005 higher or lower (or 0.05%). That may not seem like much but when you are dealing with hundreds of thousands (or even millions) of votes, it adds up. Here's an example we created in Excel for a hypothetical election with candidates A and B:
The first two columns show the actual vote counts, the next two show the ratio with the default nine-digit precision in Excel. The next two columns show the ratios rounded to the third decimal like in the Edison files PedeInspector used. The final two columns show what the vote count would be if the total vote count was multiplied by the rounded ratio for each candidate.
As you can see right away, even with relatively small numbers of votes, the calculated numbers of votes are immediately off by a few compared to the real numbers. Only if the ratio by chance happens not to need rounding does the calculated number of votes line up with reality, like it does in the third row.
But add one vote, as you can see in the last row, and the rounded numbers shift. In this case, one extra vote for A in the real vote count makes it appear B lost around 4000 votes in the calculated number (while A only gains a fraction of a vote).
Obviously, this is not evidence someone stole or shifted 4,000 votes, it simply means you can't calculate exact vote counts from rounded data.
Lead Stories reached out to Central City News for comment and we will update this story when we receive their reply.