Was the United States energy independent four months ago, before President Joe Biden came into office? Has it lost ground in terms of energy independence, and has this resulted in gas shortages in May 2021? No, none of those things are true: In January 2021 the U.S. consumed more energy than it produced, its energy independence rises and falls, and there is plenty of gas in reserve.
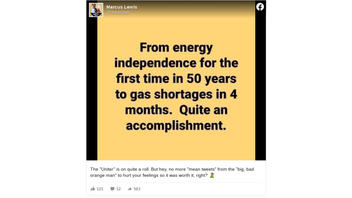
The phrase "From energy independence for the first time in 50 years to gas shortages in 4 months. Quite an accomplishment." began to appear on social media on May 10, 2021. One example is a Facebook post (archived here) from May 11, 2021, with the caption,"The 'Uniter' is on quite a roll. But hey, no more 'mean tweets' from the 'big, bad orange man' to hurt your feelings so it was worth it, right?"
This is what the post looked like on Facebook on May 12, 2021:
(Source: Facebook screenshot taken on Wed May 12 19:23:11 2021 UTC)
In 2019, when Donald Trump was president, the U.S. did achieve energy independence, something that had not happened since 1957. This switch from energy dependence to independence is not a straight line of increases, but fluctuates monthly. Since 2019 the overall trend has been more energy production than consumption -- but there have been several months when the U.S. did not produce as much energy as it consumed, including December 2019, January, February and December 2020, and January 2021.
Lead Stories has written about another erroneous energy independence claim, you can read that here.
This is the most recent information available. We do not yet know how the Biden administration will affect the nation's energy overview.
Gas shortages that many on the East Coast faced in May 2021 have to do with distribution problems coupled with panic buying. There is not actually a shortage of gasoline as there is plenty of gas in reserve. The Colonial Pipeline, shut down due to a ransomware attack, said it was again operational as of May 12, 2021, and that gas supplies would be at normal levels again in several days.
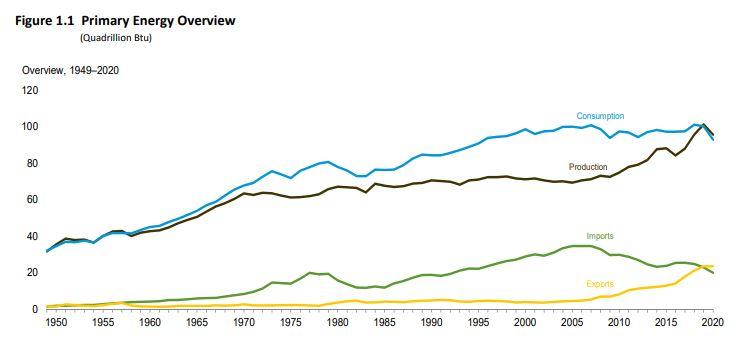
The U.S. Energy Information Administration's Monthly Energy Review has some charts that show the monthly ups and downs as well as larger annual trends. In the first graph it is possible to see the long gap between the blue line and the black line from 1957 to 2019, when energy production was never greater than consumption. The EIA explains:
In 2019, U.S. energy production exceeded U.S. energy consumption on an annual basis for the first time since 1957. The United States produced 101.0 quads of energy and consumed 100.2 quads. After record-high energy production and consumption in 2018, U.S. energy production grew 5.7% and energy consumption decreased by 0.9% in 2019.
(Source: U.S. Energy Information Administration screenshot Wed May 12 21:13:27 2021 UTC)
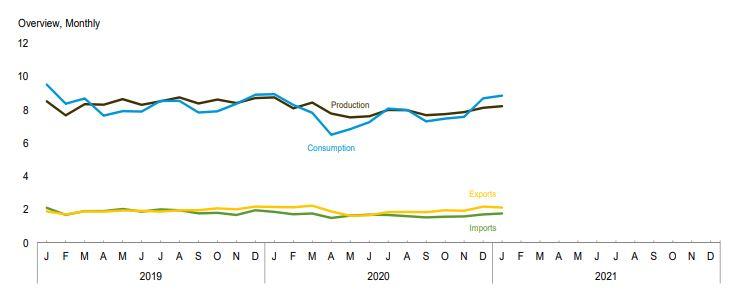
This second graph, charted by months instead of years, tells a slightly different story with the same two lines. Between March and April 2019 is the moment when, after 62 years, the black line representing production crosses over the blue line of consumption. The two lines, which appear trending downwards but parallel in the previous chart, actually touch and cross several times over the course of 2019 and 2020 during the second half of Trump's term. In the winters recorded in this graph, the national energy consumption has outpaced production.
(Source: U.S. Energy Information Administration screenshot Wed May 12 21:13:27 2021 UTC)


