Did "corrected" vote totals from the 2020 election presented by Mike Lindell at his election fraud Cyber Symposium as "Truth" support the theory that fake ballots were injected into every state's official election returns? No, that's not true: Lindell's "Truth" totals add up to the same number of votes he calls "The Big Lie," which are the final tallies that have appeared in multiple official and unofficial sources. Those tallies were compiled without the aid of the data Lindell used in declaring the election was hacked. It is nonsensical that Lindell's "Truth" tally would match "Big Lie" tallies in state after state, since he and a Ph.D. chemist ally named Douglas Frank claim to know that many fake votes were injected in order to change the result.
You cannot claim, at the same time, that the "corrected" result has exactly the same total number of votes as the official one (just distributed differently between candidates) and then claim the difference was caused by fake votes being injected via an algorithm.
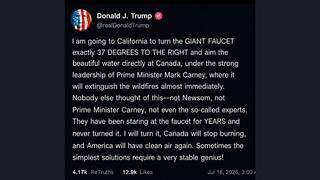
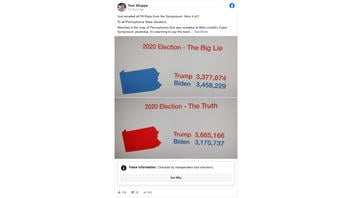
The claims were made over the course of his three-day Cyber Symposium in South Dakota and relayed in part in a post (archived here) published on Facebook on August 11, 2021. It opened:
Just emailed all PA Reps from the Symposium. Here it is!!!
This is what the post looked like on Facebook at the time of writing:

(Source: Facebook screenshot taken on Thu Aug 12 16:22:29 2021 UTC)
Lead Stories assigned staff to watch the live stream of the three-day Cyber Symposium and paid to send a nationally-known cybersecurity expert to the symposium to analyze in person the data Lindell promised to release. Lindell says he has 37 terabytes of intercepted internet traffic (packet captures, often referred to as 'PCAPS') which he says will prove how fraudulent votes were injected into official state vote tallies in order to steal the election. Note that at the time of publication none of this data has been released, despite Lindell's earlier promises this would happen.
Over the first two days of the symposium, Lindell broadcast a series of charts showing numbers he said were the true results from the 2020 election, alongside those he called "The Big Lie." We compiled screen shots of his slides for each of the 50 states and the District of Columbia from live streams of the event on rumble.com and other sources streaming the event:
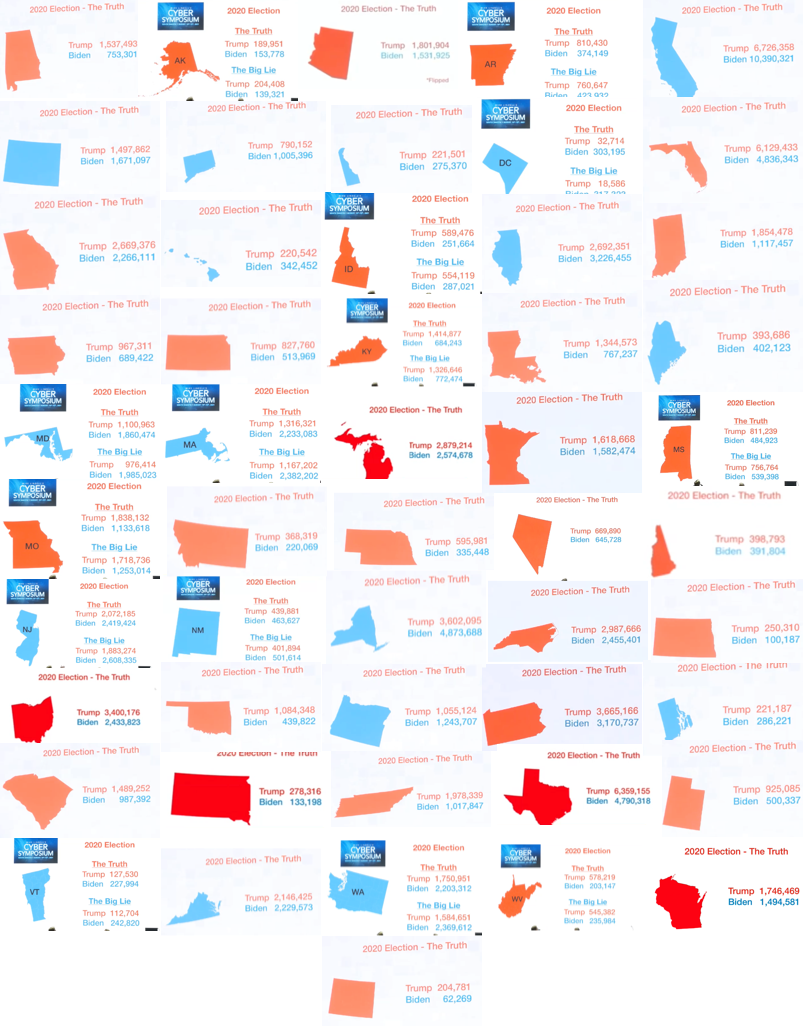
(Source: screengrabs of Lindell's slideshow from Tue Aug 10 and Wed Aug 11, 2021 UTC and collected all in one image)
(NOTE: Lindell stated during the symposium that the totals for Alaska were mistakenly reversed on the slide shown above)
First, our fact checker noticed that the slide for Nevada was not like the other states: The vote total for Trump was the same in both the "Big Lie" and "Truth" analysis, while Biden's "Truth" number was lower than the official tally, resulting in Trump winning Arizona by their estimation:

(Source: screengrab taken August 10, 2021 UTC)
For Lindell's "Truth" numbers to be correct, the wide-ranging attack on the election would have had to DELETE votes in Nevada. But, at the time the slide was displayed, Lindell and Frank insisted votes and voter registration had been ADDED for Biden in all 50 states. Their theory does not explain how, in Nevada, there are nearly 60,000 Biden ballots certified by the state.
The other possibility is that the data presented for the state of Nevada at the symposium is false or mistaken.
But that got us started on looking at his numbers closely.
Simple comparison of Lindell's "Truth" numbers to official tallies reveals a logic problem
To see if Nevada was an anomaly, we gathered all the "Big Lie" tallies from Lindell's slides into a spreadsheet and added the totals for both candidates, by state. Then we compared Lindell's number of total votes, by state, to the publicly available election tallies, by state, as reported in the Cook Political report, the MIT Election Data and Science Lab, and Wikipedia.
In almost every state, Lindell's "Truth" total matches the official and expert vote totals. Those are the totals he calls "The Big Lie".
Even including the data presented for Nevada, the totals are within .004 and .005% of each other. And, if we assume that the 57,758 vote discrepancy for Nevada was an honest mistake, the difference among the vote totals presented by Lindell amount to a nationwide discrepancy of 21,207 votes between Lindell's "Truth" total and that of Cook Political report totals, 24 votes between Lindell's "Truth" total and that collected by MIT, and not a single vote's difference between Lindell's "Truth" total and the totals found on Wikipedia at the time this fact check was written. That's 0 deviation between Lindell's total number of votes and the total found on Wikipedia (other than the glitch on Lindell's Nevada slide.)
That means that Lindell claims the total number of ballots cast in the election was largely correct, he only disagrees with who those ballots were cast for.
In the following chart, a yellow-highlighted FALSE shows any total that does not match Lindell's "Truth" total.

(Source: Lead Stories spreadsheet created with Google Sheets, using data displayed at Mike Lindell's Cyber Symposium August 10 and August 11, 2021)
If three trusted sources of the official election results that Lindell calls "The Big Lie" show the same total numbers of presidential votes in each state, that means Lindell and Frank's "Truth" analysis did not account for any of the fake ballots Lindell and Frank claim they have shown were injected into the vote totals by Chinese hackers.
Frank was featured in Lindell's film "Scientific Proof" in which Frank marries Lindell's claim that he has evidence voting machines were hacked to Frank's statistical analysis. Frank says the hackers used 2010 census data and past election results to build plausible voting patterns by which to pump up the vote for Biden with fake votes.
But if the "Big Lie" vote total is the result of adding votes, those hacked-election official totals should be significantly higher than Lindell's "Truth" totals. Instead, it appears Lindell and Frank took the certified election results and just rearranged each candidate's tally without subtracting the votes both men claim they can prove were added in.
Lead Stories emailed questions about the data puzzle to the address by which Lindell has communicated with us multiple times in recent months. That message was sent August 12, 2021 and we will add his response, as appropriate, when we receive it.
Lead Stories also emailed questions to Frank, via the address he uses on his church and business website, on August 12, 2021. Lead Stories also texted a request for information to the phone number for Frank we found on his church website, and also called the number in an attempt to leave a message. Frank's explanations will be included when we receive them.
The election hack that injected fraudulent fake votes, as described by Frank in advance of the Cyber Symposium:
On the opening day of the symposium, Frank said he has been a guest speaker in 13 states and is working with 30 more to show how he used his training as a Ph.D. analytical chemist to find unnaturally consistent patterns of voter registration and voting in the 2020 presidential election. Frank says it is proof that hackers stole the election from Donald Trump by using digital backdoors to the election registration system to add fraudulent phantom voters who were used to boost the number of votes for Biden.
The following is a slide displayed at the Cyber Symposium to summarize Frank's claim:
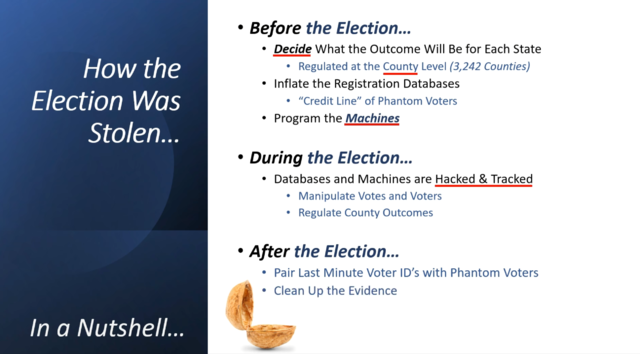
(Source: Frankspeech.com screenshot of presentation at Cyber Symposium taken August 11, 2021)
Here, from a YouTube video, (archived here) is how Frank says the hack was carried out, by adding votes:
... at the beginning before the election each county registration rolls are artificially inflated. For example, people who have passed away you don't remove them from the registration role so that gives you extra voters or people that have moved away you can put them back in and that gives you extra voters ... they can't vote anymore because one's moved away or one's passed away but yet we somehow are still receiving ballots from people like that so those are called phantom ballots or phantom voters and so that's the first thing is you inflate the registration rolls ...they inflate the registration rolls and then during the election they monitor what's happening and insert those phantom ballots appropriately as needed and they start with predictions ahead of time so they have targets they're shooting for and that makes it easy to back-calculate what they're doing because you can see them reaching their targets and then after the election they have to do cleaning up afterwards and we have proof of each one of those steps.
Frank's theory, that fake voters and fake votes were added, is not reflected in the charts Lindell offered as the "True" numbers of votes.
Although Frank describes a plot he says hurt Republican incumbent Donald Trump, the Republican-led Oversight Committee of the Michigan State Senate refuted claims Michigan's election was hacked (claims repeated by several speakers at the Cyber Symposium) and in its June 23, 2021, report on its investigation, singled out Frank by name as having spread false information.
Dr. Frank's conclusions are not sound for several reasons. Census data is not recent, and people do not only move away (as he frequently contends) but others do move into an area. Coupled with same day registration the notable red flags he spotted in the data are easily explained, e.g. young people do not vote as readily as older citizens, people's movements create disparities between registrations and the census, etc.
The patterns he sees are not unexpected or unusual to elections or human behavior in general.
His theories depend on the ability to hack into the tabulators before or during and/or at the end of the election.
Many of the counties he and others identified as having been hacked do not even have modems or make any online connection to submit results. Those that do, do not connect the modem, which is physically separate from the Dominion tabulator, until after the polls are closed and the tabulators have printed the official results."