Did someone remove the satellite weather data from May 19, 2024, in the region of Jolfa, Iran, where a helicopter carrying Iranian President Ebrahim Raisi crashed in foggy conditions in the mountains? No, that's not true: As of May 21, 2024, the satellite product from the Cooperative Institute for Research in the Atmosphere has the archived weather data for that region on May 19, 2024. A video posted on social media making the claim that the data for May 19, 2024, was missing may have shown a technical glitch. A statement from the Colorado State University Director of Issues Management clarified that there was a delay over the weekend in transferring data from the server to the tool.
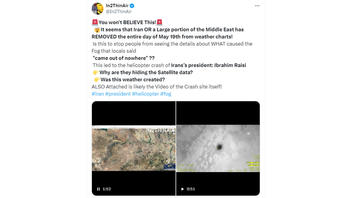
The claim appeared in a post (archived here) published on X by @In2ThinAir on May 19, 2024. The post was captioned:
🚨You won't BELIEVE This!🚨
🤯It seems that Iran OR a Large portion of the Middle East has REMOVED the entire day of May 19th from weather charts!
Is this to stop people from seeing the details about WHAT caused the Fog that locals said
'came out of nowhere' ??
This led to the helicopter crash of Irans's president: Ibrahim Raisi
👉Why are they hiding the Satellite data?
👉Was this weather created?
ALSO Attached is likely the Video of the Crash site itself!
#iran #president #helicopter #fog
This is how the post appeared on X at the time of writing:
(Source: X screenshot taken on Tue May 21 15:22:12 2024 UTC)
The post was followed with another that said:
Even IF this isn't weather manipulation that data was removed for a reason.
Something is being hidden.
People will ignore this info because they will see that I post on weather manipulation and assume that is all I'm thinking here and its not. We have many reasons as to why they would remove this data, Weather manipulation is just one.
The fact that this specific day is missing is what's important
I haven't confirmed yet but apparently the data is missing from other weather sites as well.
If this ends up being nothing ill admit that in a heartbeat.
That has never been a problem but something is up here.
As I've said before even if this is NOT manipulation the data is missing and it shouldn't be!
Lead Stories has not found evidence that data was removed or is missing. When we retrieved the archived data for May 19, 2024, on the same imagery service, we were able to view data from that day. Lead Stories emailed the Cooperative Institute for Research in the Atmosphere (CIRA) at Colorado State University (CSU) to see if they could explain the glitch captured in the video. On May 21, 2024, Dell Rae Ciaravola, the director of issues management with the CSU Media relations team, responded. She wrote:
RAMMB SLIDER is a research tool that is not monitored or maintained outside of normal business hours. Occasional data outages and delays occur. It's not intended to provide public access to immediately available and up-to-date data. Data from the weekend was uploaded on Monday after a hard drive filled up over the weekend, delaying transmission from a server to the tool.
Included in the @In2ThinAir post are two video clips. The first, the focus of this fact check, is 2:15 minutes long and shows a Google Earth video of the globe with political boundaries. At 32 seconds in, a CIRA satellite weather map takes the place of the Google Earth map. This data is from the Meteosat-9 (at 45.5 east longitude) displayed on the Regional and Mesoscale Meteorology Branch (RAMMB) slider, matching the political boundaries of the Google Earth view, centering the Jolfa, Iran crash site. At 33 seconds into the video, the map data timestamp is: 2024-05-18 14:30:00 UTC. The "Time Step" on the control bar on the left edge of the screen indicates the display is set to show a new image captured in 15-minute increments. As @In2ThinAir advanced through the data, the timestamps did advance in 15-minute increments until 2024-05-18 23:45:00, at which point the timestamp inexplicably skips past all of May 19 to 2024-05-20 00:00:00 UTC.
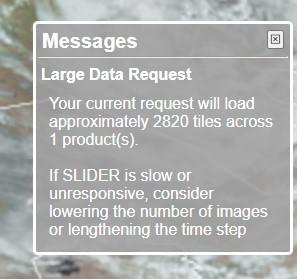
At the time of writing on May 21, 2024, Lead Stories tried to duplicate this glitch and could not. Because days have passed, we had to use the "Archived Imagery" controls to set a begin and end date for the data we wanted to view. We kept the number of images (60) and the time step (15 minutes) the same as the control panel settings in the @In2ThinAir video. When we set the times, a notice came up on the screen (pictured below) warning that this was a large data request. It reads:
Messages
Large Data Request
Your current request will load approximately 2820 tiles across 1 product(s)
If SLIDER is slow or unresponsive, consider lowering the number of images or lengthening the time step.
(Source: rammb-slider.cira.colostate.edu screenshot taken on Tue May 21 16:20:03 2024 UTC)
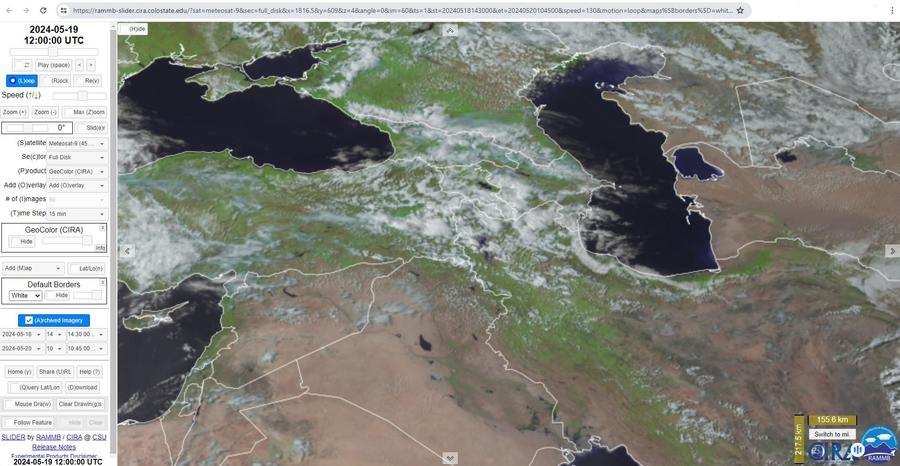
Although it did take some time to load, the data did come through and shows a frame for each 15-minute increment -- including throughout May 19, 2024, which @In2ThinAir claimed was not available. The screenshot below shows one frame of the data for May 19, 2024, at 12:00:00 UTC.
(Source: rammb-slider.cira.colostate.edu screenshot showing data for 2024-05-19 12:00:00 UTC taken on Tue May 21 18:20:26 2024 UTC)
Additional Lead Stories fact checks on claims regarding the helicopter crash that killed the Iranian President Ebrahim Raisi can be found here.


